Lens 1: Stochastic Parrots
Scale and Environment
Learning question
Which environmental and data choices are hidden by a model’s apparent performance?
A benchmark score shows what a model can do. It does not show what the model costs, or where its data come from.
Slides: CC BY 4.0. Lesson page and worksheet: maehr.github.io/stochastic-parrots-and-beyond
1. Scale is not a sufficient criterion
- Bender et al. ask: “How big is too big?” (2021, 610).
- Rising costs “doubly [punish] marginalized communities”: they benefit least and suffer the environmental consequences first (610).
- A language model stitches together linguistic forms “without any reference to meaning: a stochastic parrot” (617).
2. Models have a material footprint
- Energy: data centers used about 415 TWh in 2024, about 1.5% of global electricity. The IEA projects about 945 TWh by 2030, with AI as the main driver (IEA 2025).
- Water: training GPT-3 could directly evaporate about 700,000 liters of fresh water, according to an estimate by Li et al. (2025).
- Hardware: manufacturing servers and GPUs causes emissions before the first computation (Luccioni et al. 2023).
Estimates and projections. Use them as orders of magnitude.
3. Use costs energy again and again
- Each request needs energy. Use is not a one-off cost.
- Multi-purpose generative models are “orders of magnitude more expensive” than task-specific systems for several tasks (Luccioni, Jernite, and Strubell 2024).
- The same computation causes different emissions on different grids.
4. Data choices are value choices
- A larger web dataset is not a more diverse dataset (Bender et al. 2021, 613).
- One corpus discarded every page with a word from a list of about 400 “bad words”. This also suppresses spaces “built by and for LGBTQ people” (614).
- Undocumented data create “documentation debt” (615).
Case: BLOOM
Documented case
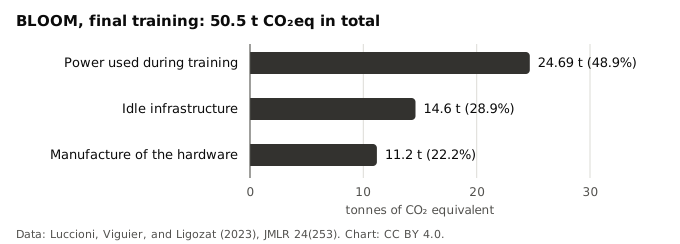
Data: Luccioni, Viguier, and Ligozat (2023). Original chart, CC BY 4.0.
What the BLOOM figures reveal
- The grid: 57 g CO₂eq per kWh in France. The authors explain the low emissions largely with this grid.
- Experiments: intermediate models emitted 35.8 t from dynamic power use, more than the 24.69 t of the final training on the same boundary.
- Use: 230,768 requests in about 18 days used 914 kWh. Roughly 75% of the energy kept the model in memory, ready for requests.
- Data: the 1.6 TB ROOTS corpus in 46 natural and 13 programming languages came with a data governance effort.
Sources: Luccioni, Viguier, and Ligozat (2023); Laurençon et al. (2022); Jernite et al. (2022).
Activity · 15 minutes
Trace one model or use case from its data sources to its use. Groups of three or four, on paper or on a laptop.
- Choose a research-use card from your group. Use BLOOM only if no card fits. (3 min)
- For each stage, note what is known, unknown, and avoidable, with a source. (8 min)
- Mark the largest unknown and one avoidable cost. (2 min)
- Prepare one sentence for the plenary. (2 min)
Worksheet: Lens 1, material-and-provenance map
Expected output
A material-and-provenance map for each group:
- known, unknown, and avoidable costs for each stage,
- a source for each entry,
- the largest unknown and one avoidable cost.
Sources
- Bender et al. (2021): On the Dangers of Stochastic Parrots.
- Luccioni, Viguier, and Ligozat (2023): Estimating the Carbon Footprint of BLOOM.
- International Energy Agency (2025): Energy and AI.
- Crawford (2021): Atlas of AI, chapter 1, “Earth”.
Takeaway
Performance is what a model shows. Provenance and footprint are what it hides. A missing number is an unknown, not a zero.
Stochastic Parrots and Beyond · Lens 1 · CC BY 4.0