Lens 1: Stochastic Parrots — Scale and Environment
Which environmental and data choices are hidden by a model’s apparent performance?
- Slot: about 35 minutes in the morning, with a 15-minute group activity.
- Output: a material-and-provenance map.
- Worksheet: Lens 1 worksheet: material-and-provenance map.
- Slides: Lens 1 slide deck.
- Anchor sources: Bender et al. (2021); Crawford (2021), chapter 1.
Question
Which environmental and data choices are hidden by a model’s apparent performance?
A benchmark score or a fluent answer shows what a model can do. It does not show what the model costs, where its data come from, or who decided what to leave out. This lens makes these hidden choices visible.
Core concepts
1. Scale is not a sufficient criterion
Bender et al. ask of language models: “How big is too big?” (Bender et al. 2021, 610). They argue that larger models trained on larger web datasets bring rising environmental and financial costs. In their words, increasing these costs “doubly punishes marginalized communities”: these communities are the least likely to benefit and the most likely to suffer the environmental consequences (Bender et al. 2021, 610). A larger model can score higher on a benchmark and still be the worse choice for a given task.
The authors define a language model as “a system for haphazardly stitching together sequences of linguistic forms it has observed in its vast training data, according to probabilistic information about how they combine, but without any reference to meaning: a stochastic parrot” (Bender et al. 2021, 617).
2. Models have a material footprint
Training and use need electricity, cooling water, hardware, and buildings. Crawford traces this material base back to mines, energy grids, and supply chains (2021, ch. 1).
- Energy. The International Energy Agency estimates that data centers used about 415 TWh of electricity in 2024, about 1.5% of global electricity use. It projects about 945 TWh by 2030, with AI as the most important driver (International Energy Agency 2025).
- Water. Data centers use water for cooling, and power plants use water to make electricity. Li et al. estimate that training GPT-3 in Microsoft’s US data centers could directly evaporate about 700,000 liters of fresh water (Li et al. 2025).
- Hardware. Servers and GPUs have an “embodied” footprint from their manufacture. It counts even when they stand idle (Luccioni et al. 2023).
3. Where and how a model runs matters
The same computation causes different emissions on different energy grids. Use is not a one-off cost: every request needs energy again. Luccioni, Jernite, and Strubell compared the energy of 1,000 inferences across task types. They found that multi-purpose generative models are “orders of magnitude more expensive” than task-specific systems for several tasks, also when the number of parameters is the same (Luccioni et al. 2024).
4. Data choices are value choices
Bender et al. show that a large web dataset is not a diverse dataset (Bender et al. 2021, 613). Filtering decisions also exclude people. One widely used corpus discarded every web page that contained a word from a list of about 400 “bad words”. The authors note that this also suppresses online spaces “built by and for LGBTQ people” (Bender et al. 2021, 614).
Scraping raises questions of consent and copyright. Large undocumented datasets create “documentation debt”: they become “too large to document post hoc” (Bender et al. 2021, 615). Loukissas reminds us that data always come from a place and an infrastructure that collected them (2019, ch. 3).
Evidence and limits
- Peer-reviewed measurements exist for some open models. The case below uses one of them.
- The IEA figures (International Energy Agency 2025) are estimates and projections for all data centers. They are not measurements of one model.
- The water figure of Li et al. (Li et al. 2025) is an estimate from a published method and stated assumptions.
- Each estimate depends on assumptions: the power draw of the hardware, the efficiency of the data center, the carbon intensity of the grid. Two methods can give different results for the same model.
- Most providers of commercial models publish no comparable figures. A missing number is not a zero.
- Figures for one model or one data center do not transfer to another system. Use them as orders of magnitude, not as exact values.
- A footprint alone does not decide whether a use is justified. Weigh it against the purpose, the alternatives, and the people who carry the costs.
- Compare alternatives for the same task, at the same boundary and quality: manual work, a search tool, a small model, or a general model with checks. A smaller or local model is a hypothesis to test, not a result.
Case: BLOOM
This case uses figures that the developers of the model measured and published in a peer-reviewed journal (Luccioni et al. 2023).
BLOOM is a multilingual language model with 176 billion parameters. More than a thousand researchers built it in the BigScience workshop, an open-science project that ran from May 2021 to May 2022. BLOOM was trained on the Jean Zay supercomputer in France, on the 1.6 TB ROOTS corpus. The corpus covers 46 natural languages and 13 programming languages (Laurençon et al. 2022; Luccioni et al. 2023).
The BigScience project published unusual detail about the footprint of the model:
| Item | Published figure |
|---|---|
| Training time | 118 days, 1,082,990 GPU hours |
| Electricity for training | 433,196 kWh |
| Carbon intensity of the French grid | 57 g CO₂eq per kWh |
| Emissions from the power that training used | 24.69 t CO₂eq |
| Emissions from idle infrastructure | 14.6 t CO₂eq |
| Emissions from the manufacture of the hardware | 11.2 t CO₂eq |
| Total for the final training | 50.5 t CO₂eq |
| Intermediate models and experiments | 35.8 t CO₂eq from dynamic power use |
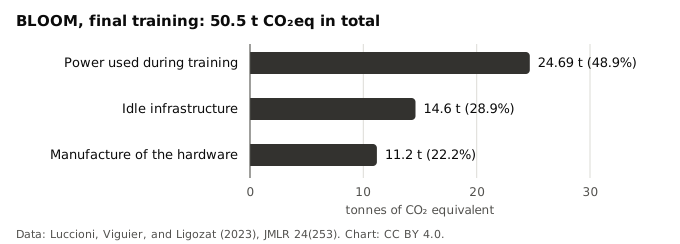
The figures also show what usually stays hidden:
- The grid. The authors explain the low training emissions largely with the low carbon intensity of the French grid. The same energy on a coal-heavy grid would cause several times the emissions (Luccioni et al. 2023).
- Experiments. The intermediate models emitted 35.8 t CO₂eq from dynamic power use. That is more than the 24.69 t of dynamic power use in the final training (Luccioni et al. 2023). Compare on the same boundary.
- Use. The authors ran BLOOM as an API on 16 GPUs for about 18 days. The instance answered 230,768 requests and used 914 kWh. They estimate about 19 kg CO₂eq per day, and note that roughly 75% of the energy went into keeping the model in memory, ready for requests (Luccioni et al. 2023).
- Data governance. The ROOTS corpus came with a data governance effort. Its authors propose a multi-party international structure to manage language data across stakeholders, values, and rights (Jernite et al. 2022).
Why this case. BLOOM is not a typical commercial model. Its makers chose to measure and publish. The case shows what a material-and-provenance map can contain when data exist. For most systems that researchers use, many cells of the same map stay empty. The empty cells are a finding.
Activity
Trace one model or use case from its data sources to its use. Work in groups of three or four, for 15 minutes, on paper or on a laptop.
- Choose the example. First choice: one research-use description from your group. Use the ready-made BLOOM case only when no description fits. (3 minutes)
- Fill in the worksheet. For each stage, note what is known, what is unknown, and what is avoidable. Note the source of each entry. (8 minutes)
- Mark the largest unknown and one avoidable cost. (2 minutes)
- Prepare one sentence for the plenary: “The choice that the performance of this system hides most is …” (2 minutes)
The stages on the worksheet are: data sources, collection and filtering, training, hardware and location, deployment and use, and your own use.
This is the first choice. A use from your own research makes the analysis concrete.
- Choose the research-use description with the most open questions.
- Its author explains the use in two minutes: the task, the system, and what they do not know about it.
- Describe the use, not the data. Do not show confidential, personal, or unpublished research data.
- Many cells stay empty for a commercial system. An empty cell is a finding.
Use the BLOOM case when no description in your group fits, or when the group prefers not to discuss its own use. The published figures fill most cells of the map. Compare them with the empty cells for a commercial chatbot.
A doctoral candidate plans to summarize 300 interview transcripts with a hosted chatbot. The map shows: the training data are unknown, the location of the data center is unknown, and the transcripts would leave the university. An avoidable cost: the candidate could test a smaller local model on synthetic text first. This example is invented for teaching.
Output
A material-and-provenance map on one sheet for each group. It lists known, unknown, and avoidable costs for each stage, with a source for each entry. It names the largest unknown and one avoidable cost.
Reading
- Required: Bender et al. (2021), sections 3 and 4: environmental and financial cost, and training data.
- Recommended: Crawford (2021), chapter 1, “Earth”; Loukissas (2019), chapter 3; Buschek and Thorp (2024) on how a large dataset is sourced and filtered.
- For the case: Luccioni, Viguier, and Ligozat (2023).
Slides
Open the Lens 1 slide deck. Press S for the presenter notes.
Timing (35 minutes). Input on the core concepts, 10 minutes. The BLOOM case, 5 minutes. Activity, 15 minutes. Plenary round, 5 minutes.
Prompts.
- “What would this map look like for the system you used last week?”
- “Which cell of the map could you fill in if you asked the provider?”
- “Which cost would you accept for your research, and which not?”
Common misconceptions.
- “The cloud is immaterial.” Point to hardware, water, and grids.
- “A smaller footprint makes a use responsible.” The footprint is one dimension among four lenses.
- “No published figure means a small footprint.” A missing figure is an unknown, not a zero.
Difficult moments. Some participants feel guilt about their own use. Keep the focus on decisions and alternatives, not on individual blame. Panarchy in the afternoon takes up the institutional levels.
Fallback. Start with the group’s own example. If no description fits, use BLOOM. If the group finishes early, ask it to fill in the map for a commercial chatbot and to count the empty cells.