Panarchy and Ecocycle
Find changes across levels that make generative AI use in research more responsible
- Slot: the afternoon. Panarchy takes 120 minutes. The 30-minute afternoon break falls between step 7 and step 9. The adapted Ecocycle takes 30 minutes.
- Outputs: a shared Panarchy chart, three priorities, action owners, a review point, and an Ecocycle diagnosis.
- Handouts: Panarchy chart, fictional example, Ecocycle sheet, sticky notes and action plan.
- Slides: Panarchy and Ecocycle slide deck.
- For teachers: the facilitator guide gives every step with minute marks and spoken prompts.
The challenge
The four lenses showed costs, harms, hidden labor, and incentives. Most of them are not in the hands of one researcher. Panarchy asks where change is possible, and at which level.
What changes across interconnected levels would make generative AI use in academic research more responsible?
What Panarchy is
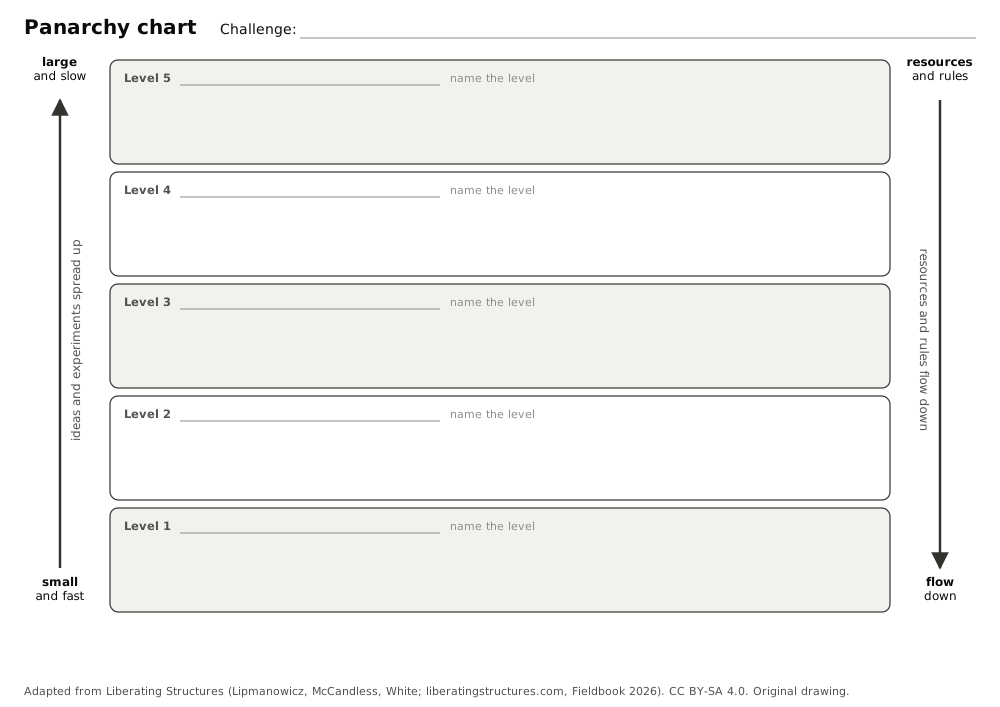
Panarchy is one of the Liberating Structures. With it, a group identifies “opportunities and obstacles for spreading ideas at multiple levels” of its environment (Liberating Structures 2026b). The idea comes from the study of social-ecological systems (Holling 2001):
- Small, local levels change fast. A research project can change its practice next week.
- Large levels change slowly. A university, an industry, or a law changes over years.
- The levels influence each other in both directions. A local experiment can spread upwards. Resources and rules from a large level shape what is possible below.
Discover your own levels. The group decides which levels matter for the challenge. The list below is only an illustration. Do not copy it.
individual research project → research group or department → university and research sector → model vendors and industry → regulation and society
How the exercise works
You work alone, in pairs, in groups of four, and with everyone. With up to 16 participants, four groups of four work well. Everyone contributes.
| Phase | Steps | Minutes | What you do |
|---|---|---|---|
| Frame | 1 | 5 | Hear the challenge and see an example chart |
| Map influences and levels | 2–5 | 35 | List factors alone, sort them into levels in pairs, compare in fours, build one shared chart |
| Diagnose | 6–7 | 25 | Mark levels that get little attention, and uneven resources |
| Afternoon break | 8 | 30 | Rest |
| Find opportunities and barriers | 9–10 | 25 | In new groups of four, find leverage and blockages across levels |
| Prioritize and commit | 11–12 | 25 | Vote for three priorities, then plan actions with 1-2-4-All |
| Follow up | 13 | 5 | Decide in groups of three how and when to revisit the chart |
| Total | 150 |
1-2-4-All is a Liberating Structure in its own right. You think alone first, then share in a pair, then in a group of four, then with everyone. Each person speaks before the loudest voices dominate.
The fictional example shows a completed chart. Its content is invented.
Ecocycle: a 30-minute adaptation
The full Ecocycle Planning takes about 90 minutes (Liberating Structures 2026a). This course uses a 30-minute adaptation. The Panarchy page of Liberating Structures suggests adding 30 to 50 minutes for an Ecocycle diagnosis (Liberating Structures 2026b). This segment is not a full Ecocycle workshop. The phases are a heuristic for discussion, not a law of how institutions change.
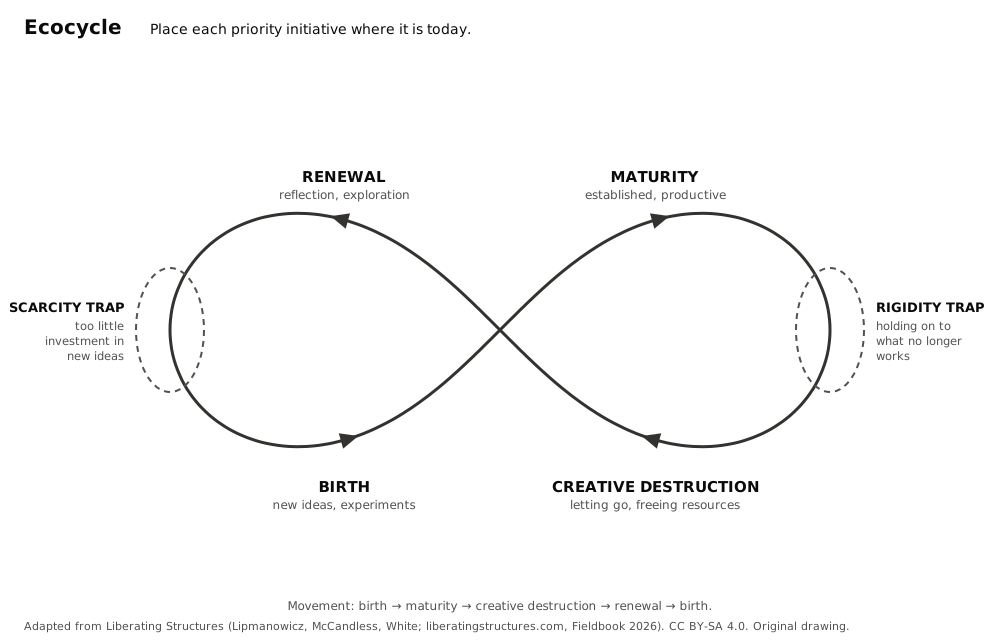
Ecocycle sorts initiatives by their phase of life. Each priority from the Panarchy chart is an initiative: a rule, a practice, a tool, a project.
| Phase | What it means for an initiative |
|---|---|
| Birth | A new idea or experiment. Few resources, much uncertainty. |
| Maturity | An established practice. It is productive and uses most of the resources. |
| Creative destruction | An ending. Letting go frees attention and resources for something new. |
| Renewal | Reflection and exploration. New networks and ideas form before the next birth. |
Two traps block the movement through the phases (Liberating Structures 2026a):
- The rigidity trap lies between maturity and creative destruction: holding on to an old way although it no longer works.
- The scarcity trap lies between renewal and birth: not investing enough in new ideas, so that they never grow.
| Minutes | Step |
|---|---|
| 5 | Hear the four phases: birth, maturity, creative destruction, renewal. |
| 5 | Place the priority initiatives from the Panarchy chart on the Ecocycle. |
| 10 | Find the initiatives in the scarcity trap and in the rigidity trap. |
| 5 | Propose a move for each trapped initiative: what to start, stop, or support. |
| 5 | Record concrete next steps on the action plan. |
| 30 |
What you produce
- A shared Panarchy chart with levels, influences, and annotations.
- Three priorities: high-leverage opportunities or barriers.
- Action owners: who acts on each priority.
- A review point: when and how the group revisits the chart.
- An Ecocycle diagnosis of the priority initiatives, with the traps and the proposed moves.
- Your own next action on the action plan.
Pen and paper are enough
The exercise needs no online whiteboard and no account.
- A large printed Panarchy chart on the wall, or the chart drawn on flip-chart paper.
- A printed chart for each participant.
- Sticky notes and thick pens.
- The Ecocycle sheet and the action plan, printed.
Take a photo of the shared chart if the group wants to keep it. Do not photograph people without their consent.
Attribution and license
The structures and illustrations used in this session are adapted under Creative Commons Attribution-ShareAlike 4.0 from the original work of Keith McCandless, Henri Lipmanowicz and Nancy White found at www.liberatingstructures.com and the Liberating Structures Fieldbook (2026). Licensed under CC BY-SA 4.0.
Henri Lipmanowicz and Keith McCandless created the original repertoire (Lipmanowicz and McCandless 2014). Keith McCandless and Nancy White wrote the Fieldbook (McCandless and White 2026). The step labels on this page are adapted. The step durations follow the original. The diagrams are original drawings. This page uses no Liberating Structures icons.
This page and its handouts are licensed under CC BY-SA 4.0.