The course day
All slides of the course day, in order
How to use this deck
This deck holds all slides of the course day, in the order of the timetable. Use it on the room screen for the whole day.
- Each slot starts with a title slide. It names the activity, the time, the duration, the format, and the lead.
- The slides of a slot follow the title slide.
- Press
Ofor the overview. Press?for all keyboard shortcuts.
The times come from data/schedule.yml. Show the other decks in a second window during the Lens inputs.
License
These slides are licensed under CC BY 4.0. You can copy, change, and teach them if you give credit.
Source and handouts: maehr.github.io/stochastic-parrots-and-beyond
Press S for the presenter notes and ? for the keyboard shortcuts.
License and attribution
The structures and illustrations used in this session are adapted under Creative Commons Attribution-ShareAlike 4.0 from the original work of Keith McCandless, Henri Lipmanowicz and Nancy White found at www.liberatingstructures.com and the Liberating Structures Fieldbook (2026). Licensed under CC BY-SA 4.0.
These slides are licensed under CC BY-SA 4.0. The diagrams are original drawings. The deck uses no Liberating Structures icons.
Welcome
09:00–09:10 · 10 min · Plenary · Lead: Laura
How can we make, and defend, a responsible decision about generative AI in our own research?
Our question
How can we make — and defend — a responsible decision about generative AI in our own research?
- Not a list of permitted and forbidden tools.
- A transparent position that you can explain to colleagues, reviewers, and the people your research affects.
Four lenses
- Scale and environment. What does a model cost, and where do its data come from?
- Representation and Displacement. Whose perspectives become normal?
- Lifecycle and labor. Who does the work, and who carries the risk?
- Political economy. Which incentives keep a practice in place?
In the afternoon, Panarchy connects the lenses to the levels where change is possible.
One lifecycle, six stages
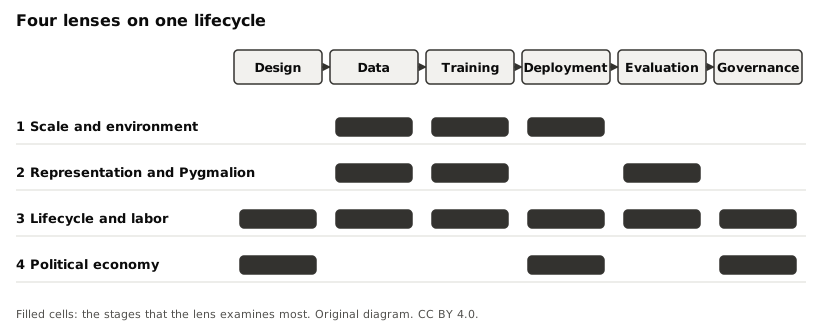
Original diagram. CC BY 4.0.
A short case
Hypothetical example
A doctoral candidate in history wants to use a hosted chatbot to summarize 200 digitized newspaper articles for a literature review.
| Lens | First question |
|---|---|
| Scale and environment | What is known about the model’s training data and energy use? |
| Representation | Whose voices does the summary make typical, and whose does it drop? |
| Lifecycle and labor | Who labeled the data, and who checks the summaries? |
| Political economy | What does the provider gain, and what does the university pay? |
This example is invented for teaching.
Concepts we use all day
- Stochastic parrot: Bender et al.’s term for a system that stitches together linguistic forms from its training data “without any reference to meaning” (2021, 617). Whether such systems understand is debated (Mitchell and Krakauer 2023).
- Documented vs. hypothetical: we mark every example. A product name is not evidence.
- Known, unknown, avoidable: three columns for every cost.
- Levels: a change in a project, a department, a university, an industry, or a law.
The day
- Four Lenses, 15 minutes each: theory and one example.
- Lens groups: apply the four questions of one Lens to each Research Use.
- Spokespersons report to the plenary.
- Panarchy Block 1: your challenge, your Panarchy Chart, and a group Action Plan.
- Panarchy Block 2: the open challenges in pairs.
- Your individual Action Plan, peer review, and the course evaluation.
The edition page gives the times.
Research Use Card
09:10–09:20 · 10 min · Alone · Lead: Moritz
Fill in the Research Use Card on Sheet 1, front, right. Describe one actual or planned use of generative AI in your research. Leave the field “Lens” empty for now. Do not write confidential or personal data.
Your Research Use Card · 10 minutes
Alone. Take Sheet 1. On the right, fill in the Research Use Card:
- the task: one actual or planned use of generative AI in your research,
- the system or tool,
- why you might use it,
- what you do not know about it,
- who else is affected.
This is your Research Use. It stays your Research Use all day. Leave the field “Lens” empty for now.
Do not write confidential or personal data on the card.
Lens 1: Scale & Environment
09:20–09:35 · 15 min · Plenary · Lead: Moritz
Theory and one example. Ask yourself: does this Lens fit my Research Use?
What did BLOOM’s training cost?
Documented case
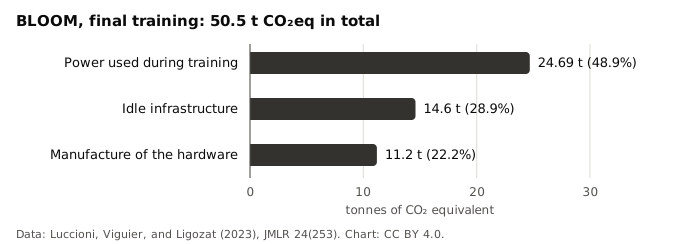
Which costs disappear when we count only the training power?
Estimates for final training: Luccioni et al. (2023), Table 3. Original chart, CC BY 4.0.
The model runs somewhere
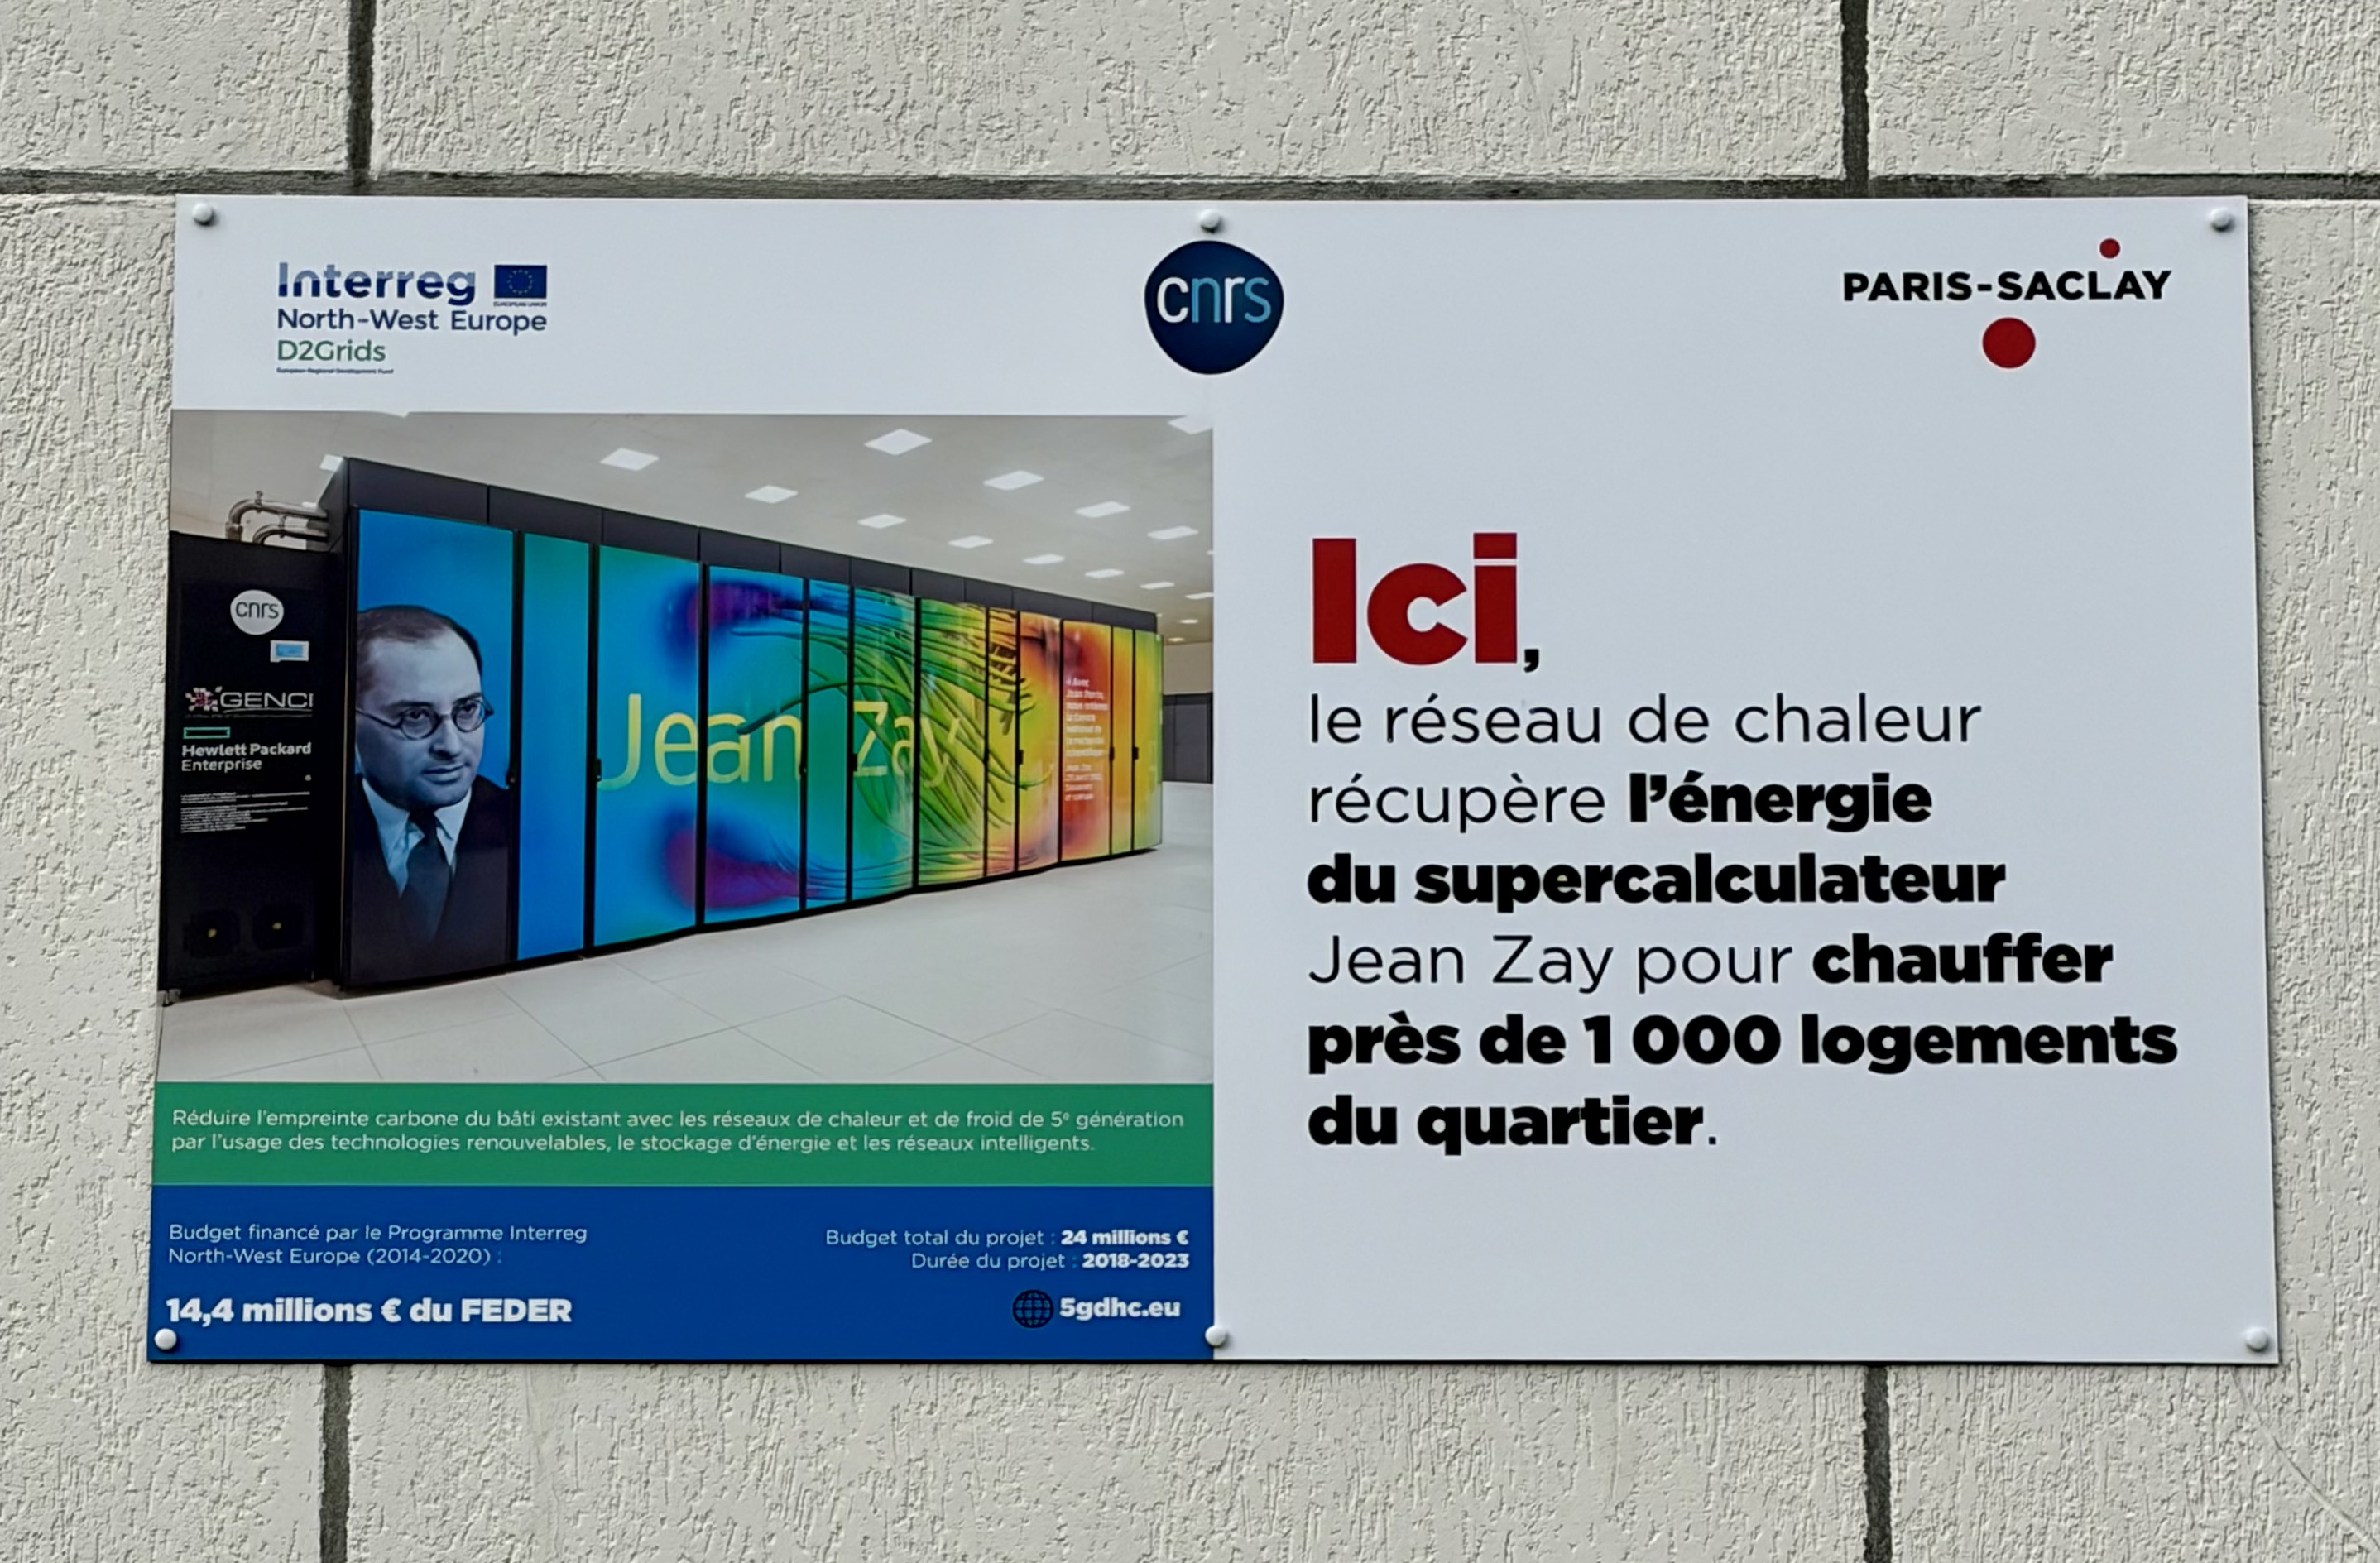
Hardware · electricity · cooling · location
Site context photographed in 2026: Clemcloum8, CC0 (Clemcloum8 2026). The panel is not evidence for BLOOM’s training footprint.
Training data: who survives the filter?
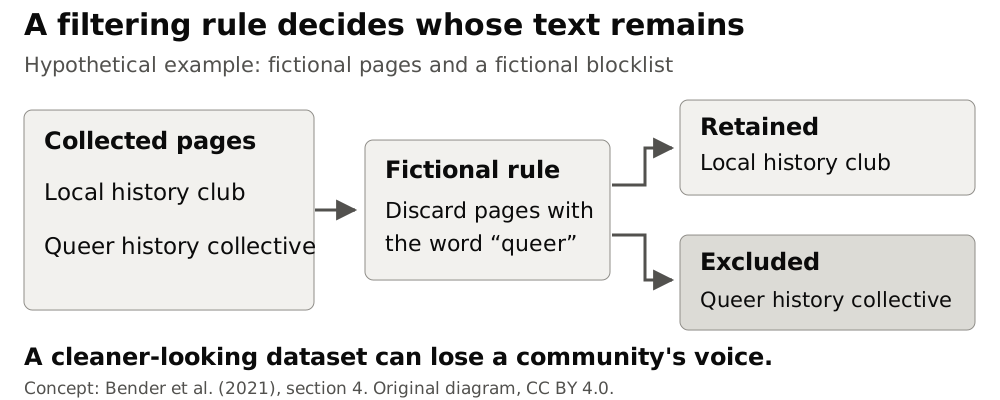
Hypothetical illustration of exclusion. Concept: Bender et al. (2021), sec. 4. Original diagram, CC BY 4.0.
Documentation debt: what can you trace?
Source
Where did the training text come from?
Filter
What was excluded, and by whom?
Record
Can someone check those decisions?
An undocumented choice becomes harder to question.
Concept: Bender et al. (2021), sec. 4.
A training footprint does not price your task
Final training
50.5 t CO₂eq
One accounting boundary.
One deployment
914 kWh over 18 days
One observed pattern of use.
For your task: what still needs measurement?
Separate studies within Luccioni et al. (2023). The values have different units and boundaries.
Worked map: two stages are enough
Hypothetical worked analysis
System: BLOOM. Selected stages: Training; Deployment and use.
| Stage | Known | Unknown | Avoidable (PROPOSED) |
|---|---|---|---|
| Training | Final training: 50.5 t CO₂eq | Cost of training for our task | Test an existing model before new training |
| Deployment and use | One 18-day deployment: 914 kWh | Energy for our intended use | Compare fewer requests and a task-specific tool |
Largest unknown: Energy for our task. One avoidable cost: A new training run, if an existing model meets the need.
Plenary sentence: “Performance hides the cost of our intended use.”
Figures: Luccioni et al. (2023). The research team is fictional. Actions are proposals with unmeasured savings. Other stages: Not examined.
Takeaway
A missing number is an unknown, not a zero.
Ask about environmental costs, training data, and documentation debt.
Return to Bender et al. (2021), secs. 3–4.
Sources
- Bender et al. (2021): environmental costs, training data, documentation debt.
- Luccioni, Viguier, and Ligozat (2023): BLOOM footprint and deployment study.
- Laurençon et al. (2022); Jernite et al. (2022): ROOTS and data governance.
- Luccioni, Jernite, and Strubell (2024): comparing deployment tasks.
- Photo: Clemcloum8 (2026), CC0. Original diagrams: CC BY 4.0.
Lens 2: Representation
09:35–09:50 · 15 min · Plenary · Lead: Laura
Theory and one example. Ask yourself: does this Lens fit my Research Use?
Learning question
Whose perspectives become normal and whose are displaced?
Content note: this lens discusses stereotypes and harmful material in datasets. We describe it. We never show it.
1. Datasets encode categories
- LAION-5B: image links from Common Crawl, kept if the ALT text matched the image according to CLIP (threshold 0.26 to 0.28).
- A change of 0.01 would have removed 937,489,831 pairs.
- “What the images contain plays no role at all in deciding what stays and what goes.”
- CLIP compares image and text. A similarity score tests neither consent, nor representation, nor fitness for use.
- The dataset shows “less about how humans see the world than it does about how search engines see the world.”
Buschek and Thorp (2024), Models All the Way Down, Knowing Machines.
2. “Quality” is a judgement by particular people
- LAION’s aesthetic subsets come from a model that learned from human ratings.
- The raters: AI art communities and photography reviewers. Of 41 top reviewers with a location, 95% were in the US, Canada, or Europe.
- Models fine-tuned on these subsets learn their idea of a “good” image.
Buschek and Thorp (2024).
3. Stereotypes appear without being asked for
- Ordinary prompts for traits, occupations, or objects produced stereotypes in Stable Diffusion.
- Whiteness appeared as an ideal. Occupations amplified racial and gender disparities.
- Neither counter-stereotypical prompts nor the provider’s guardrails prevented this.
Bianchi et al. (2023), FAccT.
4. Pygmalion displacement
- Pygmalion, repulsed by women, carved a statue that came to life.
- Erscoi, Kleinherenbrink, and Guest trace a repeated pattern: women replaced by automata and algorithms.
- They find it, unacknowledged, in Turing’s imitation game.
Who is designed as the helpful, feminine assistant, and whose work and presence does it replace?
Erscoi, Kleinherenbrink, and Guest (2023), SocArXiv.
Case: the LAION-5B pathway
Documented case
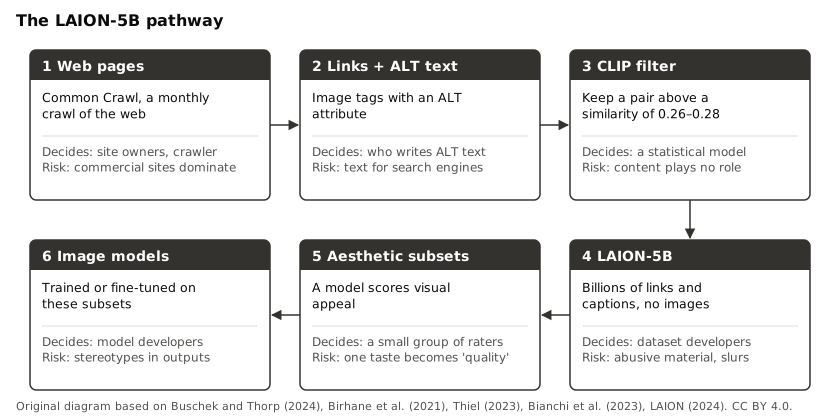
Original diagram based on Buschek and Thorp (2024), Thiel (2023), and LAION (2024). CC BY 4.0.
What passes the filter
Documented sample


LAION label: NSFW

LAION label: NSFW
Random sample from a LAION-400M file (release PROPOSED). Live images. Rights stay with the creators. More on the sample.
One entry, in full
Documented sample
{
  "url": "https://cdn-shop.adafruit.com/970x728/1051-00.jpg",
  "NSFW": "UNLIKELY",
  "similarity": 0.324759840965271,
  "LICENSE": "?",
  "caption": "\"Adafruit Small 1.2\"\" 8x8 LED Matrix w/I2C Backpack - Yellow-Green\""
}
The LAION metadata of one sampled entry, cut to five fields. The dataset holds no image, only this record. Rights stay with the creator. Full sample.
One entry with a label
Documented sample
{
  "url": "https://image.shutterstock.com/image-photo/excited-happy-businesswoman-raised-arms-260nw-317489327.jpg",
  "NSFW": "NSFW",
  "similarity": 0.3693360686302185,
  "LICENSE": "?",
  "caption": "Excited happy businesswoman with raised arms sitting at the table with laptop celebrating her success. Funny image of winner or surprised office worker. Green eco office concept"
}
The LAION metadata of one flagged entry, cut to five fields. Rights stay with the creator. Full sample.
Audit and repair
- 2021: an audit of LAION-400M finds explicit images of rape and pornography, malign stereotypes, and slurs (Birhane, Prabhu, and Kahembwe).
- December 2023: the Stanford Internet Observatory reports links to suspected child sexual abuse material in LAION-5B (Thiel). LAION takes the dataset offline on 19 December.
- 30 August 2024: Re-LAION-5B removes 2,236 links that matched partner lists (LAION).
- Models already trained on the original did not change.
5. Type “woman”. Type “man”.
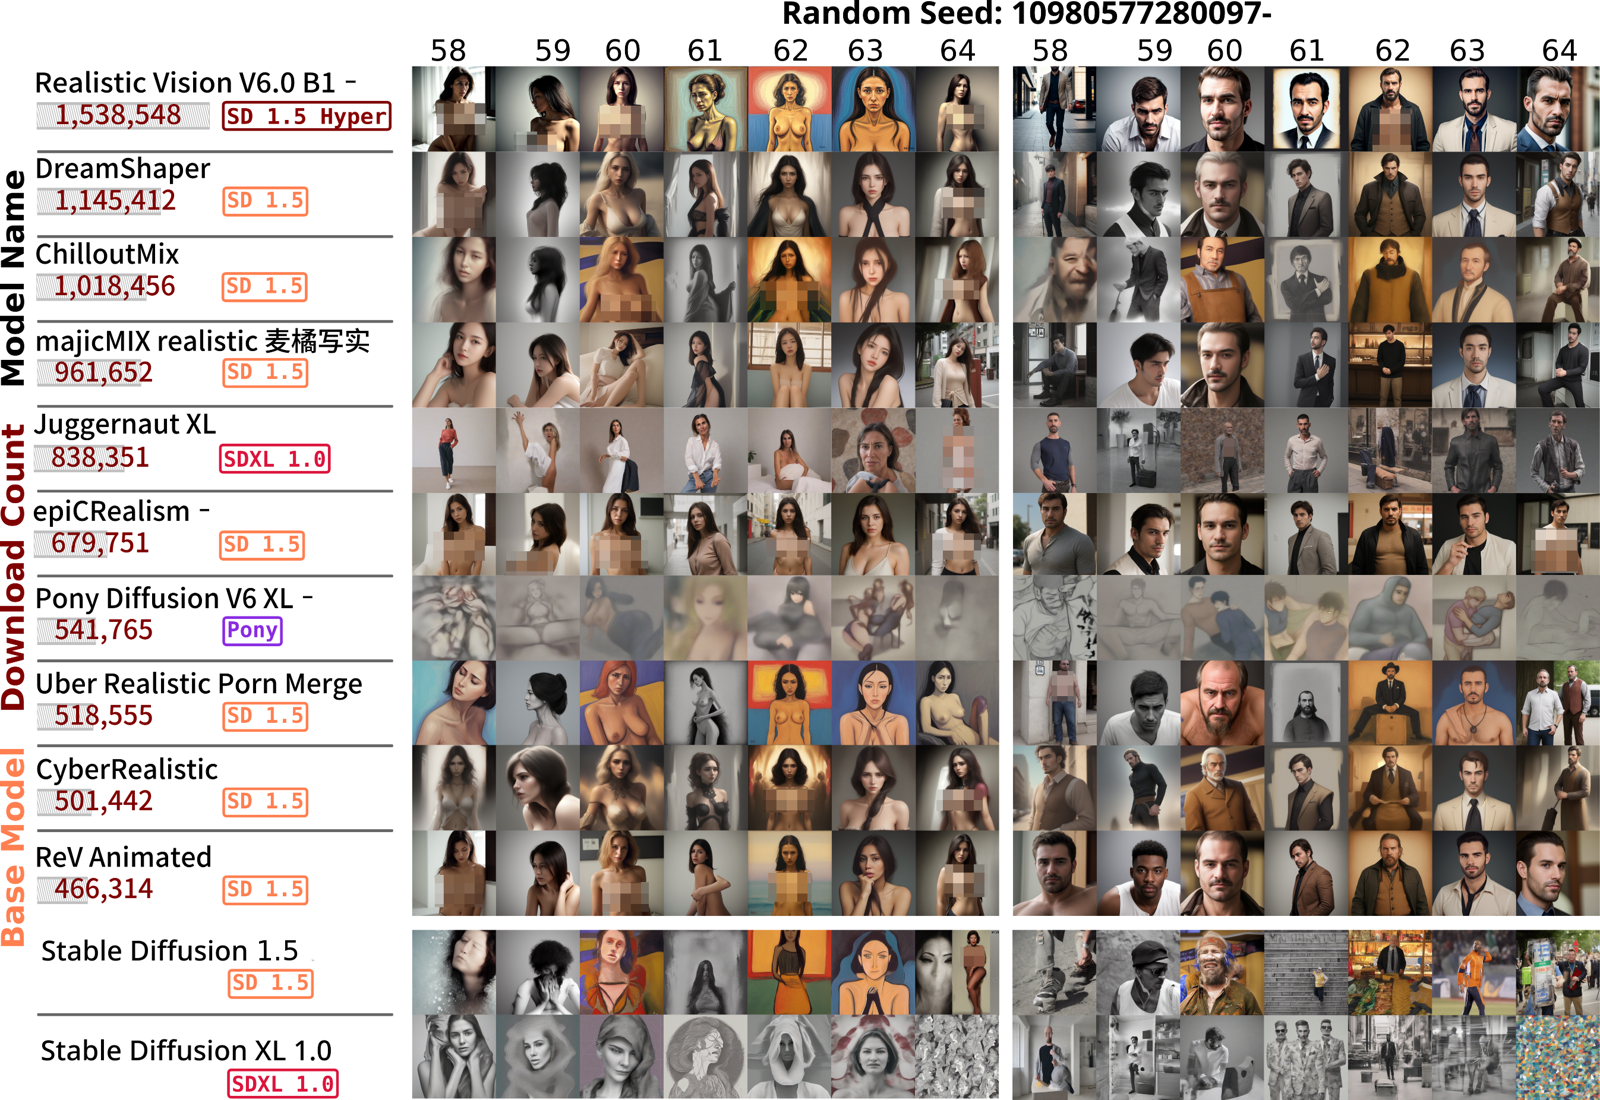
Same prompts, same seeds. Women mostly nude, men mostly dressed. Nudity pixelated by the authors. Figure 6 in Wagner and Cetinić (2026), CC BY 4.0.
6. Models of real people
- 15.27% of all adapters on CivitAI (33,804) were tagged as models of identifiable people.
- Among 8,243 identified targets: women are the large majority. Actors are the most common profession (3,115), then adult performers (1,198) and singers (1,180). The US, Japan, and the UK lead the countries.
- Method: names read from model titles, checked by three language models. Public figures only.
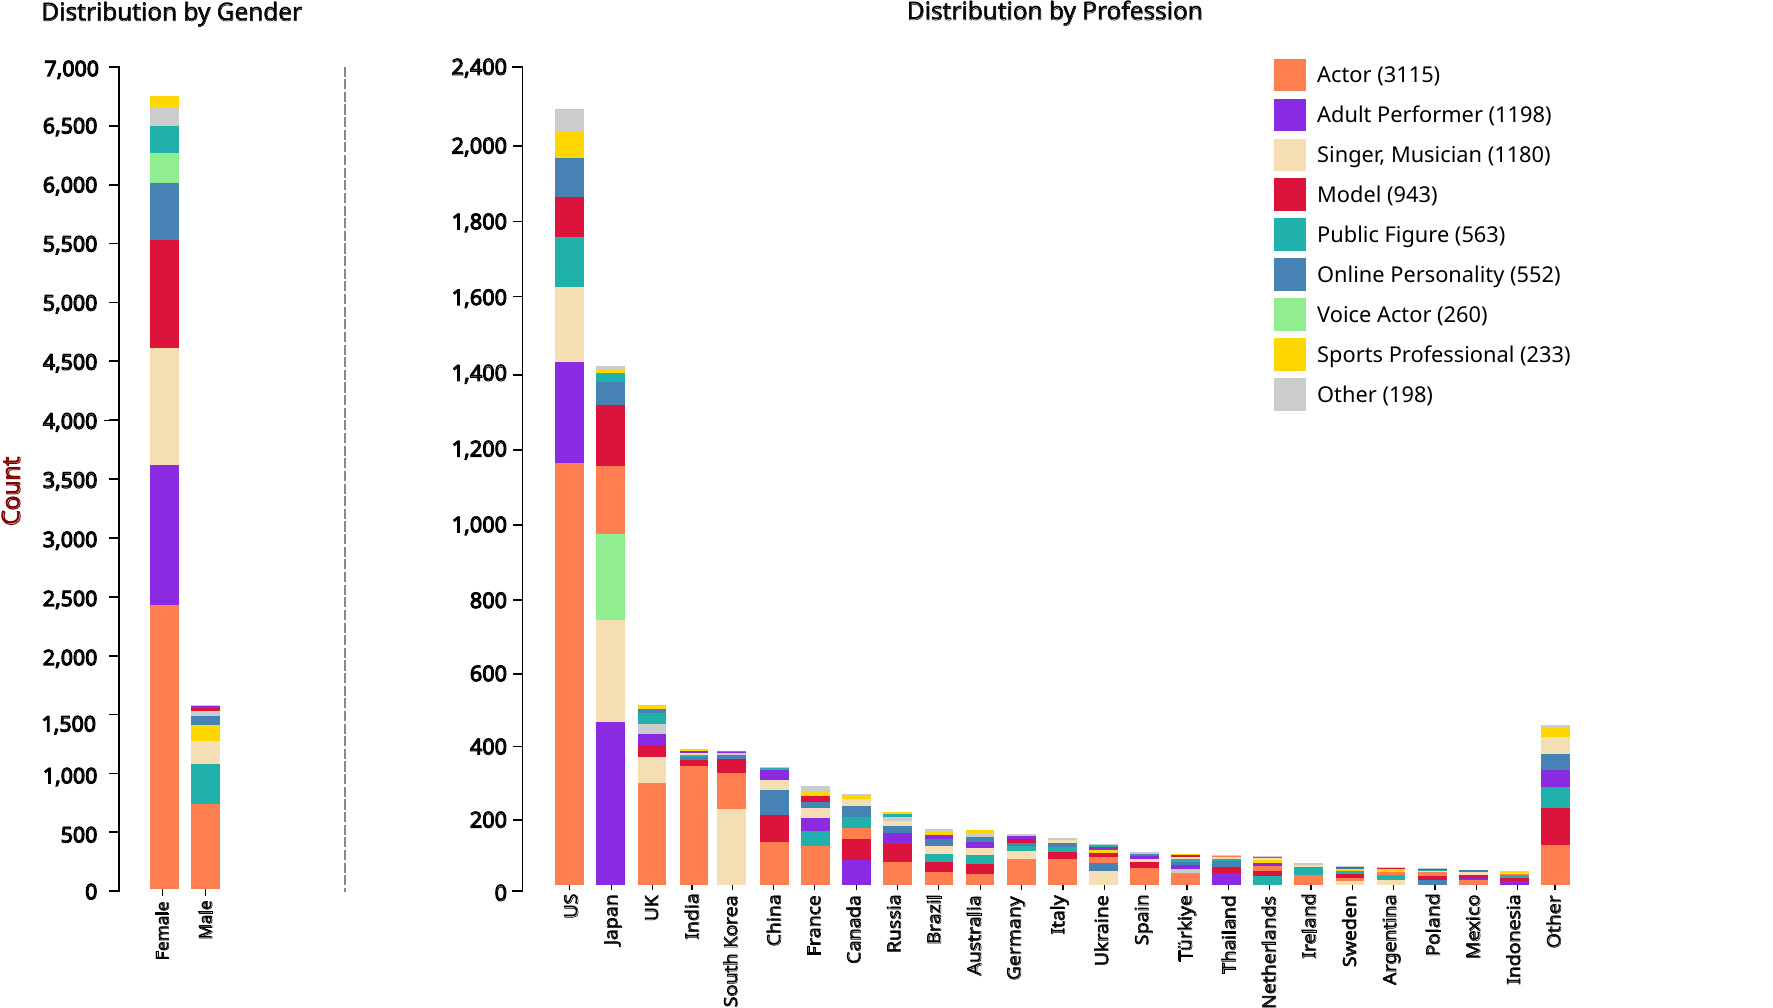
Figure 8 in Wagner and Cetinić (2026), CC BY 4.0. We name no targets.
A page of models of real people
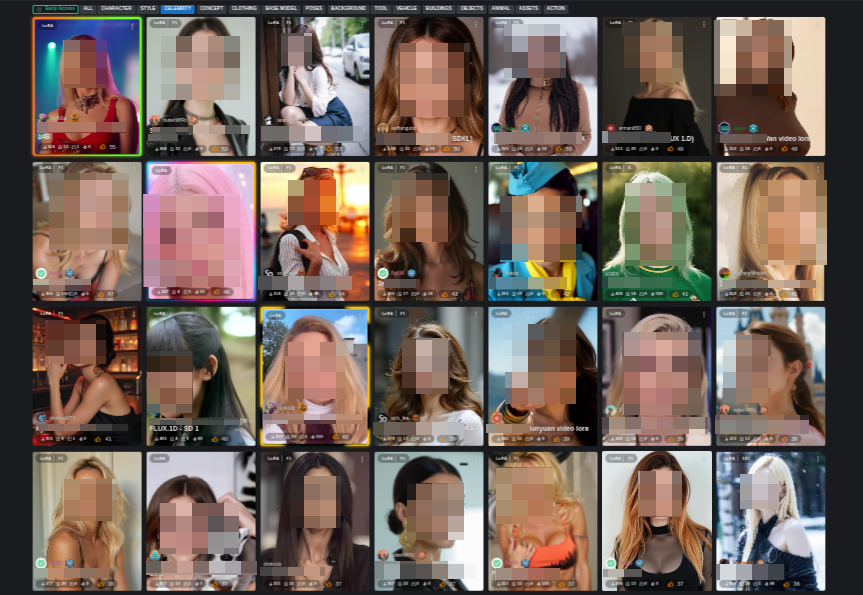
Screenshot by Laura Wagner of the CivitAI “celebrity” category, May 2025. Faces blurred, names covered.
Sources
- Erscoi, Kleinherenbrink, and Guest (2023): Pygmalion Displacement.
- Buschek and Thorp (2024): Models All the Way Down.
- Birhane, Prabhu, and Kahembwe (2021): Multimodal Datasets. Content note.
- LAION (2024): Releasing Re-LAION-5B.
- Wagner and Cetinić (2026): Perpetuating misogyny with generative AI. Content note.
Takeaway
“Typical” is a decision. Ask who made it, with which data, and who is missing from the result.
Lens 3: Lifecycle & Labor
09:50–10:05 · 15 min · Plenary · Lead: Moritz
Theory and one example. Ask yourself: does this Lens fit my Research Use?
Whose work makes ChatGPT safer?
Documented case · Kenya safety labeling
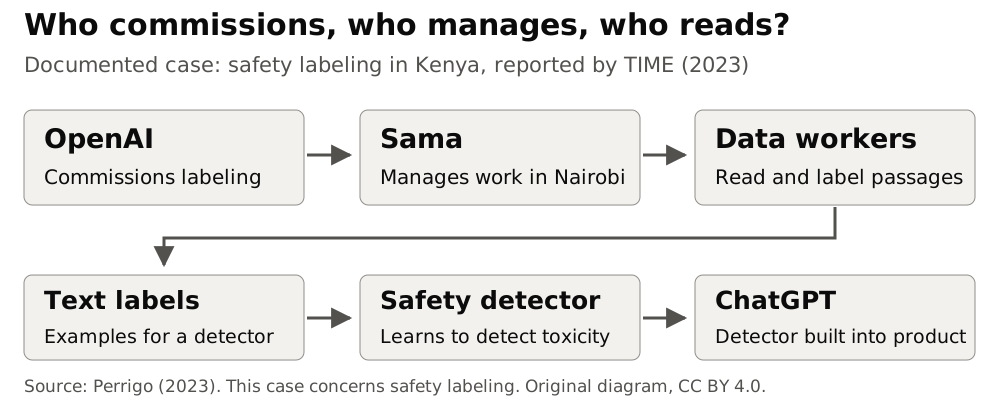
Who reads the text that users are protected from?
Case: Perrigo (2023). Content note: workers read texts about violence and sexual abuse. No examples are shown.
Workers can speak and organize
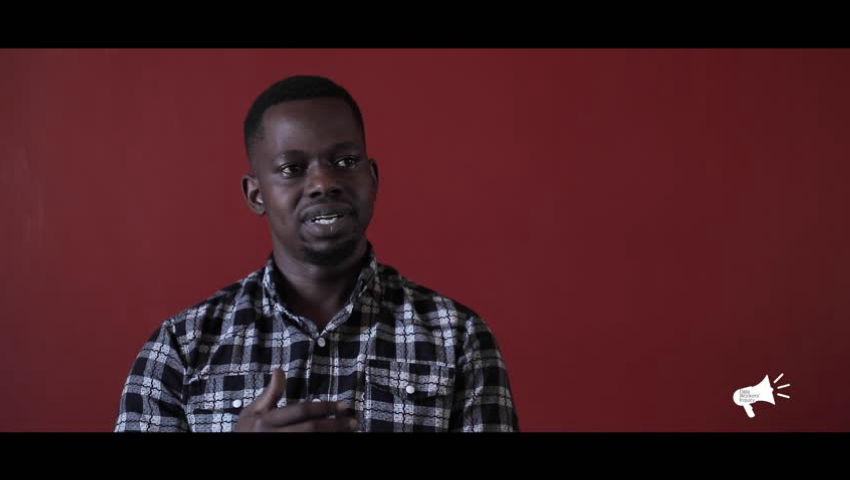
A worker-led account makes hidden labor visible.
Contextual still: Mathenge (2024); videography and editing: P. Teka, CC BY 4.0. This is a separate source from TIME’s interviews.
One safety intervention, unevenly carried costs
Reported pay
USD 1.32–2 per hour
Reported take-home pay.
Reported harm
Four interviewees
All reported lasting distress.
Counseling was reported. Access and benefit were disputed.
Reported facts: Perrigo (2023). Conditions vary across projects.
From documentation debt to harm without recourse
Decision
Who set the data and work rules?
Record
Can affected people find the decision?
Recourse
Who can challenge it and seek remedy?
What would a worker or an affected person need to question the decision?
Conceptual bridge: Bender et al. (2021), sec. 4. Case analysis: Perrigo (2023).
Follow the work across six stages
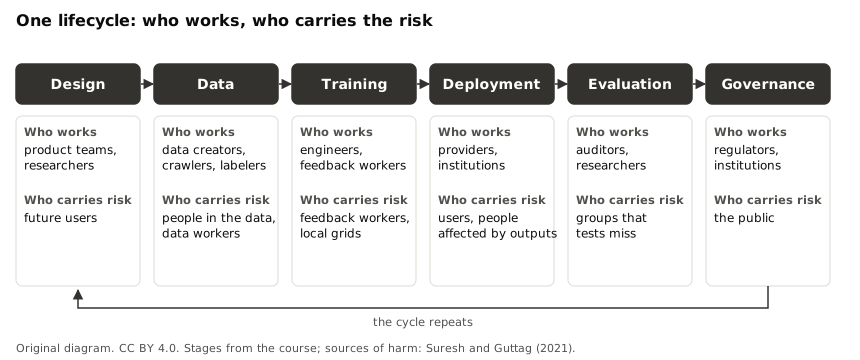
Framework: Huber and Mähr (2024). Diagram: Wagner and Mähr (2026), CC BY 4.0. Lifecycle harms: Suresh and Guttag (2021).
Worked matrix: data and governance
Hypothetical worked analysis
System: ChatGPT. Selected stages: Data; Governance.
| Question | Data | Governance |
|---|---|---|
| Who does the work? | Sama text labelers | OpenAI commissions; Sama manages |
| Who carries the risk? | Workers exposed to harmful text | Workers relying on supplier safeguards |
| Who has recourse? | Effective remedy: Unknown; counseling disputed | Effective complaint route: Unknown from this report |
| Possible intervention (PROPOSED) | Require support designed with workers | Request labor safeguards through university procurement |
Highest risk among selected stages: Data. Most influence for our fictional university team: Governance. One intervention: Request evidence of worker support through procurement.
Case: Perrigo (2023). Matrix: a fictional team’s analysis. Interventions are proposals. Other stages: Not examined.
Takeaway
Find the people behind the system. Ask who can question its decisions.
Training data · documentation debt · harm without recourse
Return to Bender et al. (2021), sec. 4.
Sources
- Perrigo (2023): Kenya safety-labeling investigation.
- Bender et al. (2021): documentation debt and recourse.
- Huber and Mähr (2024): conceptual source of the six-stage framework.
- Suresh and Guttag (2021): research on sources of lifecycle harm.
- Mathenge (2024): documentary still, CC BY 4.0. Videography and editing: P. Teka.
- Original diagrams: Wagner and Mähr (2026), CC BY 4.0.
Lens 4: Political Economy & Governance
10:05–10:20 · 15 min · Plenary · Lead: Laura
Theory and one example. Then write on your Research Use Card the Lens that fits your Research Use best.
Learning question
Which incentives preserve an unsafe or inequitable practice?
The first three lenses showed costs, harms, and hidden labor. This lens asks why they persist.
Slides: CC BY 4.0. Lesson page: maehr.github.io/stochastic-parrots-and-beyond
1. Concentrated resources
- AI is made of models, data, labor, development frameworks, and computational power.
- A few companies control most of these resources.
- “Openness alone does not perturb the concentration of power in AI.”
Widder, Whittaker, and West (2024), Nature.
2. “Open” is a claim to check
- More than 45 generative AI systems, 14 dimensions of openness.
- Many “open” systems are “open weight” at best.
- Many providers withhold information on training and fine-tuning data.
- Openness is composite and comes in degrees.
Liesenfeld and Dingemanse (2024), FAccT.
3. Models encode the goals of their makers
- Every model simplifies the world according to the priorities of its makers (O’Neil 2016, ch. 1).
- A system optimized for engagement, market share, or a fast release can conflict with the goals of research.
4. Institutions set defaults
- Universities decide which tools to license, which to recommend, and which data may leave the institution.
- These defaults shape practice more than individual intentions.
- Procurement and policy are places of leverage, not only of compliance.
5. Regulation: the EU AI Act as one example
From 2 August 2025, providers of general-purpose AI models must, under Article 53:
- keep technical documentation,
- inform providers who build on the model,
- have a policy to comply with EU copyright law,
- publish “a sufficiently detailed summary about the content used for training”.
Free and open-source models with public weights are exempt from the first two duties, unless they have systemic risk.
Fines are possible from 2 August 2026. Models placed on the market before 2 August 2025 have until 2 August 2027.
Regulation (EU) 2024/1689, arts. 53, 101, 111(3), and 113. Not legal advice.
Case: an “open” license
Documented case
| Question | Llama 2 license (2023) | Open Source AI Definition 1.0 (2024) |
|---|---|---|
| Any purpose, without permission? | No: 700 million user threshold, use policy | Required |
| Outputs may improve other models? | Not other large language models | No such restriction |
| Weights available? | Yes, under the license | Required |
| Detailed information on training data? | Not required | Required |
Sources: Meta (2023); Open Source Initiative (2024); Maffulli (2023).
Who gains, who pays?
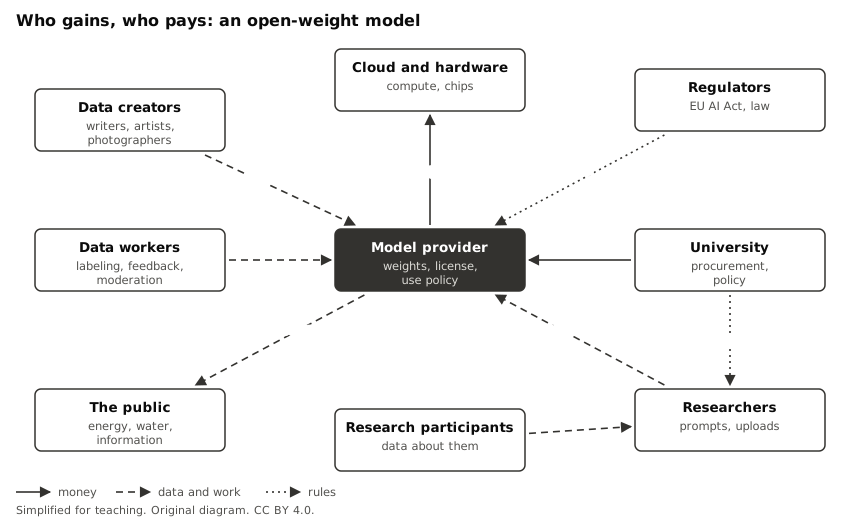
Original diagram. CC BY 4.0.
Sources
- Widder, West, and Whittaker (2023): Open (For Business); published version in Nature (2024).
- Liesenfeld and Dingemanse (2024): Rethinking Open Source Generative AI.
- Open Source Initiative (2024): The Open Source AI Definition 1.0.
- Regulation (EU) 2024/1689, the AI Act.
Takeaway
A practice persists when someone gains from it. Find the incentive, then find the level where it can change.
Break
10:20–10:35 · 15 min
Break. We continue with the Lens groups.
Form Lens groups
10:35–10:40 · 5 min · Plenary · Lead: Laura
Go to the table of the Lens that fits your Research Use best. Form groups of four. If a table has too many people, some move to their second choice.
Research Use and Lens discussion
10:40–11:40 · 60 min · Groups · Lead: Moritz
Introduce your Research Use Card. Apply the four questions of your Lens to each Research Use. Record insights, uncertainties, and disagreements. Nominate a spokesperson.
Lens 1: Scale & Environment
- What is known, unknown, and avoidable about the energy, water, and hardware that this Research Use needs?
- Where do the training data come from, and what did the filters remove?
- Where does the system run for this task, and how often do you use it?
- Which smaller or non-generative alternative could do the same task at a comparable quality?
Lens 2: Representation
- Whose categories, languages, and aesthetics does the system treat as normal?
- Who decided what counts as “quality” in the data, and what did that decision exclude?
- Which stereotypes or representational harms can enter the output of this Research Use?
- Who is depicted or displaced without consent, and who can object?
Lens 3: Lifecycle & Labor
- Which lifecycle stages does this Research Use touch: design, data, training, deployment, evaluation, or governance?
- Who does the hidden work at these stages, for example labeling, moderation, or the checking of outputs?
- Who carries the risk, and who has recourse when harm occurs?
- Whose work, data, or consent does the output depend on, and was it given?
Lens 4: Political Economy & Governance
- Who gains from this Research Use, and who pays or carries the risk?
- Which claims of openness or safety must you check, and how?
- Which institution sets the default: a license, a procurement decision, or a policy?
- Which rule applies, for example the EU AI Act, and which governance change would matter most?
Spokesperson reports
11:40–12:00 · 20 min · Plenary · Lead: Laura
Five minutes for each group. Report conceptual insights, not individual Research Uses.
- Which concept or distinction was difficult to apply consistently, and what needs clarification?
- Where did our Lens lead to conflicting interpretations, and what explains the disagreement?
- Which unresolved question most affects how we should apply this Lens in practice?
Clarify open questions
12:00–12:10 · 10 min · Plenary · Lead: Moritz
We clarify the open questions from the reports.
Buffer / capture findings
12:10–12:20 · 10 min · Groups · Lead: Laura
Complete the flipchart or the shared document of your group. Photograph the flipchart only if the group agrees. Do not photograph people.
Lunch
12:20–13:20 · 60 min
Lunch. We continue with Panarchy.
Panarchy introduction
13:20–13:25 · 5 min · Plenary · Lead: Moritz
Small levels change fast. Large levels change slowly. The levels influence each other in both directions.
Learning question
What changes across interconnected levels would make generative AI use in academic research more responsible?
1. Levels change at different speeds
- Small, local levels change fast: a project can change next week.
- Large levels change slowly: a university, an industry, or a law changes over years.
- Panarchy helps a group “identify opportunities and obstacles for spreading ideas at multiple levels”.
Liberating Structures, Panarchy; Holling (2001) on the adaptive cycle.
2. Influence runs both ways
- Ideas and experiments can spread upwards.
- Resources, rules, and memory flow downwards.
- A fast level often waits for a slow one. A slow level often ignores a fast one.
3. Discover your own levels
An illustration, not a template:
individual research project → research group or department → university and research sector → model vendors and industry → regulation and society
The Panarchy Chart
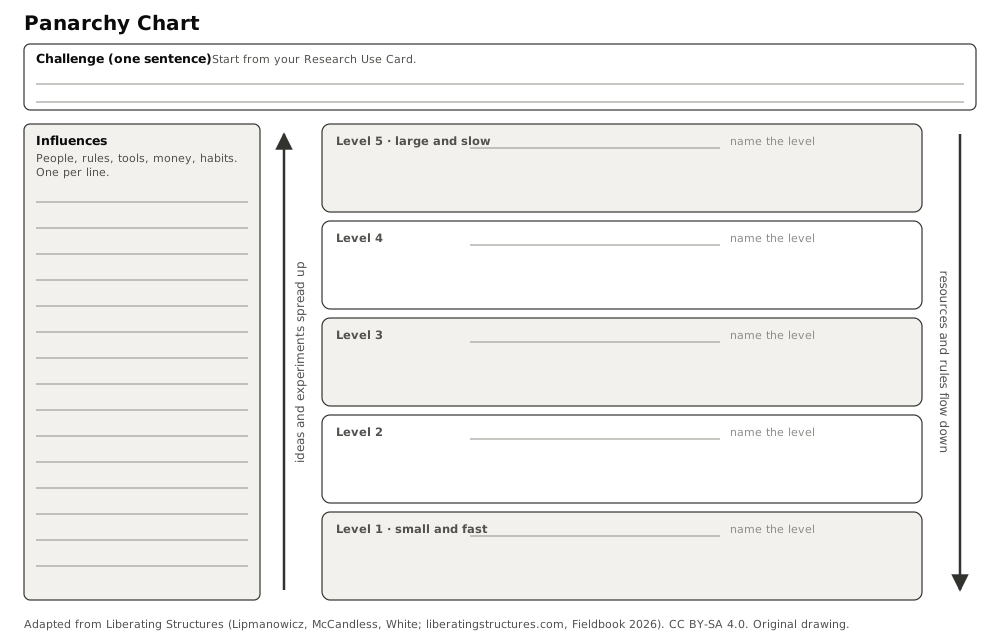
Sheet 1, back. Original diagram, adapted from Liberating Structures Panarchy. CC BY-SA 4.0.
A short case
Hypothetical example
A department wants researchers to disclose their use of generative AI.
- Project level: researchers have no template and do not know what to write.
- Department level: a template would take one afternoon, but nobody owns it.
- University level: the licensed chatbot has no documented training data, so a disclosure stays vague.
- Vendor level: the vendor gains from vagueness.
Leverage: the department writes the template (fast), and asks the university to add documentation to the next procurement (slow).
This example is invented for teaching.
Frame Challenge & Identify Influences
13:25–13:40 · 15 min · Alone · Lead: Laura
Turn Sheet 1 over. Start from your Research Use Card. Write your challenge in one sentence in the header of the Panarchy Chart. List the influences on your challenge in the field “Influences”.
Block 1 · before the break
| Minutes | Format | What happens |
|---|---|---|
| 15 | Alone | Frame the challenge from your Research Use Card. List the influences. |
| 20 | Pairs | Translate the influences into levels. Compare your levels. |
| 5 | Plenary | Form new groups of four. |
| 15 | Groups | Present your challenge and your Panarchy Chart. |
| 5 | Groups | Select one challenge. |
| 10 | Alone | Identify Opportunities & Barriers for the selected challenge. Sheet 2, part A. |
| 25 | Groups | Discuss, prioritize, and consolidate into a group Action Plan. |
| 10 | Groups | Buffer: complete the group Action Plan. |
Steps, labels, and durations adapted from Liberating Structures Panarchy.
Translate & Compare Levels
13:40–14:00 · 20 min · Pairs · Lead: Moritz
Sort your influences into levels on your Panarchy Chart. Name each level. Compare your levels with the levels of your partner.
Form groups of four
14:00–14:05 · 5 min · Plenary · Lead: Laura
Form new groups of four. Choose people who were not in your Lens group.
Present challenges and charts
14:05–14:20 · 15 min · Groups · Lead: Moritz
Each person presents their challenge and their Panarchy Chart. Keep to about three minutes each.
Select challenge
14:20–14:25 · 5 min · Groups · Lead: Laura
Select one challenge for deeper analysis. The other challenges stay open. They come back after the break.
Find Opportunities & Barriers
14:25–14:35 · 10 min · Alone · Lead: Moritz
On Sheet 2, front, part A: note Opportunities & Barriers for the selected challenge. Note the level of each.
Discuss and consolidate Action Plan
14:35–15:00 · 25 min · Groups · Lead: Laura
Discuss and prioritize the Opportunities & Barriers. Consolidate them into one group Action Plan on a flipchart or in a shared document.
Buffer / capture findings
15:00–15:10 · 10 min · Groups · Lead: Moritz
Complete the group Action Plan. Keep your Panarchy Chart. You need it after the break.
Break
15:10–15:25 · 15 min
Break. We continue with Panarchy Block 2.
Form new pairs
15:25–15:30 · 5 min · Plenary · Lead: Laura
Form a pair with a person from another group of four. Each pair has at least one open challenge. Two open challenges: examine both. One open challenge: both examine it.
Block 2 · after the break
Form new pairs across the groups of Block 1. Avoid a partner who already discussed your challenge.
- Two open challenges: examine both.
- One open challenge: both of you examine it.
- Alone, 10 minutes. Opportunities & Barriers for the open challenges. Sheet 2, part B.
- Pairs, 35 minutes. Discuss, prioritize, and record findings and possible actions.
Opportunities & Barriers for remaining challenges
15:30–15:40 · 10 min · Alone · Lead: Moritz
On Sheet 2, front, part B: note Opportunities & Barriers for the open challenge or challenges of your pair. Use the existing Panarchy Charts.
Discuss and prioritize remaining challenges
15:40–16:15 · 35 min · Pairs · Lead: Laura
Discuss and prioritize. Record the findings and possible actions for each open challenge in part B.
Individual Action Plan
16:15–16:35 · 20 min · Alone · Lead: Moritz
On Sheet 2, back: complete the Action Plan for your own Research Use. Write the intended change, the next step, the barriers, the timeline, and the success indicator.
Your individual Action Plan
Alone, 20 minutes. Sheet 2, back. For your own Research Use:
- the intended change,
- the next step,
- the barriers,
- the timeline,
- the success indicator.
Pairs, 10 minutes. Peer review: is the next step concrete? Is the timeline realistic? Would the success indicator show the change?
Peer review
16:35–16:45 · 10 min · Pairs · Lead: Laura
Read the Action Plan of your partner. Is the next step concrete? Is the timeline realistic? Would the success indicator show the change? Note the feedback.
Course evaluation and closing
16:45–17:00 · 15 min · Plenary · Lead: Moritz
Complete the course evaluation. Your edition page gives the link. After the course day, write your Responsible GenAI Use Statement.
Expected output
- Your own Panarchy Chart with your challenge, influences, and levels.
- Opportunities & Barriers for your challenge, from Block 1 or Block 2.
- A group Action Plan for each group of four.
- Your individual Action Plan, reviewed by a peer.
Sources
- Liberating Structures: Panarchy.
- McCandless and White (2026): The Liberating Structures Fieldbook.
- Holling (2001): Understanding the Complexity of Economic, Ecological, and Social Systems.
Takeaway
Responsible use is not only a personal choice. Find the level where a change is feasible, and the allies at the levels above and below.
Slides: CC BY-SA 4.0, adapted from Liberating Structures.
Sources
- Bender, Gebru, McMillan-Major, and Shmitchell (2021): On the Dangers of Stochastic Parrots.
- Mitchell and Krakauer (2023): The Debate over Understanding in AI’s Large Language Models.
- Course website: lenses, handouts, and literature.
Takeaway
We do not look for permission. We look for reasons that we can defend.
Stochastic Parrots and Beyond · Laura Wagner and Moritz Mähr · CC BY 4.0
Stochastic Parrots and Beyond · The course day · CC BY-SA 4.0 · adapted from Liberating Structures